Navigate this guide · 1,792 words
The essential signal
- Calibration concerns observed outcome frequencies among predictions with similar probabilities.
- A lower Brier score does not isolate calibration from discrimination and outcome uncertainty.
- Fit calibration on suitable independent data, then evaluate the complete model on untouched cases.
A confident number is not yet a useful probability
A classifier can return the right label while giving a misleading probability. It can also rank cases usefully while assigning probabilities that are consistently too extreme or too cautious. Probability calibration addresses that second problem: whether the numerical probabilities match observed outcome frequencies for comparable predictions. The scikit-learn guide gives the intuitive example of predictions near 0.8. For a well-calibrated binary classifier, roughly 80 percent of the corresponding cases should belong to the positive class. The statement concerns a group of cases, not certainty about any individual one.[1]
That distinction changes how a prediction should be presented. A displayed value of 80 percent is not evidence of reliability merely because the software produced it with several decimal places. Before using that number to support a decision, ask how its relationship with actual outcomes was evaluated. This article concerns classification probabilities and their calibration. It does not claim that a language model's confident wording is a probability estimate, or that every uncertainty score from an AI system has the same statistical meaning as a calibrated class probability.[1]

Accuracy and calibration answer different questions
Classification accuracy asks how often the chosen labels are correct under a defined decision rule. Calibration asks how probabilities relate to observed frequencies. Those questions overlap in practice but are not equivalent. If a mapping changes probability values without changing which side of a decision threshold each case occupies, the selected labels may remain the same. That is why evaluating a probability-producing system only by its label accuracy leaves a substantial part of its intended behavior unexamined, especially when downstream users act on the numbers rather than just the class names.[1]
Consider an illustrative group of 100 cases assigned probabilities near 0.8. If only 60 are positive, the group suggests overconfidence around that part of the probability range. It does not establish the model's performance at every other probability or prove anything about a future population with different characteristics. Keep the sample size and evaluation setting attached to the observation. A calibration claim becomes less informative when it is expanded from one group into an unrestricted promise that every confidence number from the model can now be trusted everywhere.[1]
Read both parts of a reliability display
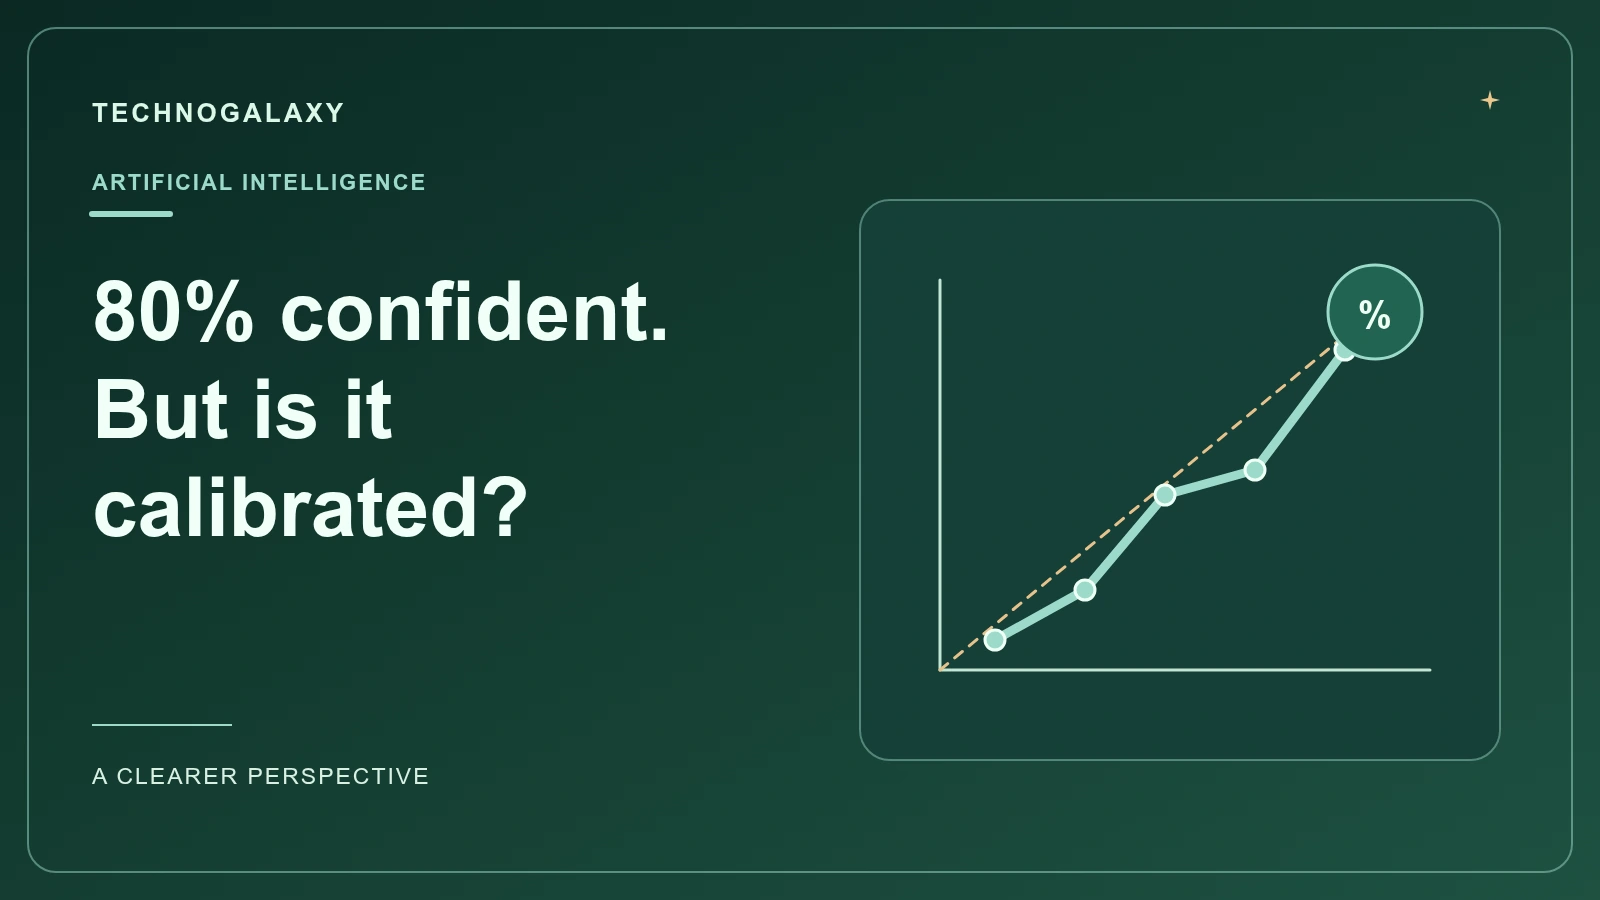
A reliability diagram groups predictions into bins. The horizontal coordinate is the mean predicted probability in a bin; the vertical coordinate is the observed fraction of positives in that bin. Agreement with the diagonal indicates agreement between those two quantities for the represented cases. This is a practical way to inspect calibration rather than treating it as an invisible property of a model. The diagram is still an estimate from data, so its shape depends on the cases included and the binning choices used to construct the display.[1]
The accompanying histogram matters because it shows how many predictions occupy each probability range. A visually striking deviation based on very few cases deserves a different interpretation from one supported by a large group. Likewise, an empty range does not demonstrate good behavior there. A useful report presents the curve and the distribution together, names the evaluation dataset and explains the binning. Without that context, a smooth-looking graphic can encourage conclusions about parts of the model's output range that the evaluation barely sampled or did not sample at all.[1]

One aggregate score cannot explain every change
The Brier score and log loss are useful proper scoring rules for probabilistic predictions, but scikit-learn cautions against treating them as isolated measures of calibration alone. They reflect calibration, discriminative information and outcome uncertainty together. A lower Brier loss therefore does not necessarily mean that calibration improved. It can accompany changes in the model's ability to distinguish cases. This is an important qualification because a single familiar metric is often easier to report than the more careful explanation needed to understand what changed between two systems.[1]
For a comparison, keep the evaluation cases fixed and inspect probability behavior alongside aggregate scores and task-relevant measures. If the score improves, ask where the improvement came from rather than immediately labeling the model better calibrated. A reliability display can help investigate that question, although it also has sampling limitations. The purpose is not to discard numerical metrics; it is to stop asking one metric to answer several different questions at once. Clear labels make a report more useful than an unexplained table in which every lower number is treated as the same kind of success.[1]
The calibrator learns another mapping
Calibration fits a mapping from a classifier's output to a probability estimate. The classifier may supply probabilities or a decision score, depending on the method and estimator. This mapping is itself learned from data. It is not a cosmetic formatting operation and should not be fitted on whichever examples happen to be convenient. The scikit-learn guide recommends data independent of the data used to fit the classifier, because predictions on training cases can be more favorable than predictions on genuinely new cases and can bias the calibration mapping.[1]
A simple experimental plan distinguishes model fitting, calibration and final evaluation. The exact splitting strategy depends on the dataset and task, but the roles should remain explicit. Do not fit the classifier and calibrator on the same convenient observations and then present performance on those observations as independent evidence. For a time-ordered or grouped problem, choose an appropriate split rather than assuming a generic random division settles every leakage risk. That split choice is an experimental-design recommendation here, not a new guarantee supplied by the calibration algorithm itself.[1]
Cross-validation has conditions too
Scikit-learn's CalibratedClassifierCV uses cross-validation to obtain predictions suitable for fitting calibrators without using a classifier's predictions on its own training subset for that purpose. The documentation distinguishes ensemble and non-ensemble behavior. The implementation details matter when reproducing a result, so record the estimator, method and cross-validation configuration rather than describing the process only as calibrated with defaults. A calibration result belongs to the full pipeline and data procedure, not just to a named mapping function applied after an otherwise unspecified model has been trained.[1]
The guide also warns that classes need to be represented appropriately in the training and test portions of the relevant splits. An absent class can lead to ineffective calibration or distorted probability behavior. This is a reason to inspect the folds, especially when one class is rare. A successful function call does not demonstrate that the statistical setup was suitable. Before interpreting the final graph, verify what each split contained and how the procedure generated the predictions used to learn the calibration relationship for the classes that actually matter to the application.[1]

Sigmoid and isotonic make different commitments
Sigmoid calibration uses a parametric logistic mapping. Isotonic calibration fits a more flexible nondecreasing relationship. The flexibility can be useful, but it can also overfit when calibration data is limited. Scikit-learn discusses these trade-offs rather than presenting one method as universally superior. Choose based on a defensible evaluation, not on the assumption that a method with fewer shape restrictions must always produce more trustworthy probabilities. More freedom to follow the available observations also means more opportunity to follow noise in an insufficient sample.[1]
For an illustrative comparison, fit each candidate under the same appropriate data separation and evaluate both on an untouched set. Retain the full probability distribution and reliability display, not just the method name that won one metric. If the available calibration sample is small, acknowledge that limitation rather than promising precise probabilities because a flexible curve can be drawn. This makes the recommendation more cautious, but also more useful: readers can see what the evidence supports and what would need a larger or more representative evaluation before a stronger conclusion would be justified.[1]
Ranking can change even when the mapping is monotonic
Calibration is often discussed as though it changes confidence without affecting ranking. Scikit-learn adds an important detail: isotonic regression can introduce ties, which can change ranking metrics such as ROC AUC. A strictly monotonic sigmoid transformation preserves ordering, while a nondecreasing stepwise mapping need not preserve every strict comparison. The distinction is small in wording but important in evaluation. Do not promise unchanged ranking behavior for every calibration method simply because the general goal is to improve the interpretation of numerical probabilities rather than to retrain the underlying classifier.[1]
This matters when the downstream system acts on a ranked queue rather than a fixed threshold. A comparison should inspect the behavior relevant to that queue as well as the probability calibration. If several formerly distinct scores become equal, the surrounding system may need a documented way to handle ties. That is a suggested integration check, not a claim that isotonic calibration is unsuitable for all ranking tasks. The broader lesson is to evaluate the actual decision process instead of assuming that every consequence of calibration is captured by one familiar reliability curve.[1]
A threshold still belongs to the application
Even a well-calibrated probability does not choose the right action automatically. A decision rule depends on what the application is trying to accomplish and the consequences of different outcomes. Calibration helps interpret the probabilities supplied to that rule; it does not define the rule on behalf of the organization using it. For this reason, a model report should distinguish probability quality from the operational threshold selected later. Calling a model calibrated is not the same as showing that a particular automated action is appropriate, fair or safe in its deployment setting.[1]
Keep the statistical claim bounded to the population and evaluation procedure used. When the operating setting changes, the previous assessment may no longer answer the current question, so review performance on relevant observations rather than treating calibration as a lifetime certification. This is an evaluation practice, not an assertion that every change inevitably causes failure. The useful habit is to preserve enough context to know what was tested: dataset, labels, model version, calibrator, split procedure, metrics and the downstream decision rule that consumes the resulting numbers in actual use.[1]

Make confidence inspectable
A practical calibration report explains the event being predicted, the meaning of the positive label, how predictions were grouped, how many cases support each part of the curve and which data was kept independent. It compares the calibrated pipeline with an appropriate baseline and avoids labeling a lower aggregate loss as proof of better calibration without further inspection. These details make the confidence number understandable to someone who did not train the model. They also make it easier to reproduce the result and identify which assumptions must hold for the interpretation to remain useful.[1]
The most important habit is to ask what a probability means across repeated, comparable predictions. If predictions near 80 percent are to guide decisions, their relationship with observed outcomes deserves evidence, not just a confident interface. Calibration provides tools for examining and adjusting that relationship, with meaningful limits around data, methods and evaluation. Used this way, it turns confidence from an impressive-looking decimal into a checkable statement. It does not remove uncertainty; it makes one part of uncertainty reporting more disciplined and easier to question when the evidence does not support the displayed precision.[1]
Questions, answered.
Does a lower Brier score always prove better calibration?
No. The score also reflects discrimination and outcome uncertainty. Inspect calibration behavior and the evaluation setup rather than treating the score as an isolated calibration measure.[1]
Should the calibrator be fitted to the classifier’s training predictions?
Use suitable independent predictions instead. The documentation warns that fitting on predictions from training data can produce a biased calibration mapping.[1]
Read the sources.
- Probability calibration, scikit-learn User Guidescikit-learn · Accessed 2026-10-14
AI assistance and source checks reduce risk; they do not guarantee error-free reporting. See our editorial policy.