
Navigate this guide · 1,541 words
The essential signal
- Condition monitoring, fault diagnosis and remaining-life prediction are different tasks.
- Useful models begin with measurements and condition indicators that fit the machine and operating context.
- An alarm should connect to a defined maintenance action, not an unsupported claim of imminent failure.
Start with the maintenance decision, not the model
Predictive maintenance is sometimes sold as AI that can tell you exactly when a machine will fail. That framing combines several different tasks and can overstate what a real project has established. MathWorks distinguishes condition indicators, fault and anomaly detection, diagnosis and remaining useful life estimation. These capabilities connect to maintenance, but they are not interchangeable. A detector that notices unusual vibration has not automatically identified the faulty component or calculated a reliable failure date. Start with the decision the organization needs to make and choose the modeling task that can support it.[1]
In a hypothetical motor installation, the first sensible action may be an inspection request rather than an immediate replacement. That narrower objective can make evidence requirements clearer. This article bridges AI and EEE through measurement and decision design; it does not claim a tested model or recommend operating procedures for a particular machine. The illustrations depict sensors and mechanical equipment without people. They are not proof of installation quality. Actual maintenance, instrumentation and safety decisions require qualified personnel, manufacturer guidance and procedures suited to the machinery and its hazards.[1]
Sensors supply evidence with a context
MathWorks documents predictive-maintenance workflows for equipment including motors, gearboxes and bearings. Measurements from those systems become useful when their meaning and acquisition conditions are understood. A vibration recording is not just a column of numbers divorced from the machine. A suggested project record identifies the sensor, mounting method, measurement direction, operating state and acquisition settings. These recommendations support reproducibility; they are not a claim that a particular sensor placement fits every machine. Instrumentation choices should follow the application and the relevant engineering requirements.[1]
Imagine a motor operating at several different speeds. A change in signal characteristics may reflect a new operating state rather than degradation. If the dataset omits operating context, the model can be asked to distinguish conditions that the available evidence does not separate. A suggested review therefore asks which contextual signals can be measured reliably and which assumptions remain. Avoid collecting extra data without a purpose. The goal is a defensible relationship between observation and maintenance question, not a large dataset that lacks the information needed to interpret an apparent change.[1]
Condition indicators give measurements a useful vocabulary
MathWorks describes building condition indicators from time-domain, frequency-domain, time-frequency and physics-based features. A condition indicator is intended to represent some aspect of system health or behavior in a form that an algorithm can use. This is a different step from simply displaying raw measurements. Feature selection can connect the data to engineering knowledge and make later judgments easier to inspect. It should still be evaluated against the actual machine and task. A feature that separates one demonstration dataset may not remain informative under another duty or sensor arrangement.[1]
For a student exercise, compare indicators against controlled, labeled observations instead of choosing whichever signal looks most dramatic. Record why each indicator is considered relevant and how it behaves during normal changes in operation. A hypothetical amplitude-related feature may move when load changes, while a different feature may capture another aspect of the signal. This article does not prescribe a fault-specific threshold. The practical aim is to discover which features are stable where stability is expected and sensitive where meaningful changes occur. Keep the engineering rationale beside the statistical result.[1]
Anomaly detection does not name the fault
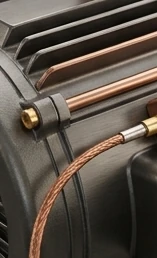
Detecting unusual behavior and identifying a particular fault are different tasks in the MathWorks workflow. An anomaly model can identify deviations from the behavior represented in its training or reference data. That can be useful when fault examples are scarce, but the output does not inherently explain the cause. An unusual operating mode, a sensor problem or a real mechanical issue may all deserve investigation. The recommended interpretation is therefore conditional: this observation differs from the model's expected behavior under the available context. It is not automatically a declaration that a bearing is failing.[1]
In a hypothetical deployment, an anomaly alert might first prompt a data-quality check, then an inspection request. Defining that path beforehand makes the model's role clearer. Also decide what information accompanies the alert: relevant measurements, operating conditions and the period over which behavior changed. This is proposed workflow guidance, not a safety-certified control system. Avoid linking an unvalidated statistical output directly to a hazardous intervention. A useful early project can support inspection planning while retaining qualified human judgment for operational decisions, especially when the consequences of a false alarm or missed event are substantial.[1]
Diagnosis needs examples that support the labels
MathWorks lists statistical methods, machine learning and deep learning among the approaches used for condition monitoring and fault detection. Selecting a method does not solve the problem of trustworthy labels. A supervised diagnosis task needs examples whose assigned conditions are meaningful for the intended application. Suggested dataset preparation records how each label was established, whether the condition was confirmed and which operating regimes the examples cover. If labels are speculative, a precise-looking classifier score can overstate the quality of the underlying evidence. The model learns from the dataset it receives, not from the maintenance story its creators hope it tells.[1]
A hypothetical laboratory bearing defect can make a useful learning dataset without proving performance on every industrial bearing. Document the experiment's limitations and separate controlled examples from field data. Also inspect whether a class label accidentally corresponds to a recording session, a sensor change or a unique speed setting. These suggested checks address possible shortcuts rather than alleging a flaw in a particular tool. A diagnosis system becomes more defensible when the task definition, label origin and deployment conditions are visible to the people who rely on it.[1]
Validation should resemble future use
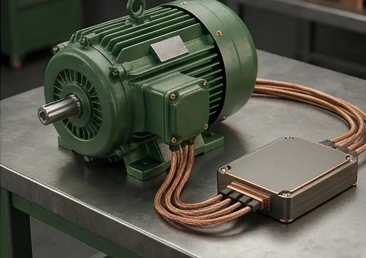
Evaluation should show how the model handles observations it has not effectively encountered already. For time-series projects, a suggested precaution is to examine how training and test recordings relate. Adjacent windows from one recording can share substantial context. If they are split casually, the evaluation may answer an easier question than performance on another machine or a later operating period. This is general experimental-design guidance, not a result claimed by the linked documentation. Define the intended generalization and construct the evaluation around that definition.[1]
One hypothetical team might monitor the same motor over time, while another needs a classifier that transfers to different motors. Those are distinct evaluations. Report them separately and retain the conditions used in each. Include normal operating changes and sensor interruptions where relevant, not only clear fault examples. A useful review compares the model with an understandable baseline and examines the cases it misses. The goal is not to collect the highest possible score. It is to establish what the score actually supports before treating the model as evidence for maintenance decisions.[1]
Remaining useful life asks a harder question
For remaining-life estimation, MathWorks identifies survival, similarity and trend-based approaches. These approaches address a different task from merely noticing that behavior is unusual. Estimating how much useful life remains requires a relationship between observed condition, progression and a defined endpoint. A suggested project review asks what failure or maintenance threshold means, which history supports it and whether the model's assumptions match the equipment's duty. A numerical remaining-life estimate without those definitions can look authoritative while leaving the most important question unresolved.[1]
A model estimate should never be presented as an exact promise about a failure date. For a hypothetical asset, operating conditions and future usage may differ from the data used to develop the estimate. A responsible interface should explain the basis and limits of the prediction and avoid implying certainty unsupported by evaluation. This article does not offer a remaining-life formula for machinery in service. It recommends separating the forecasting task from detection and diagnosis so each can be tested honestly. If the evidence supports only a condition trend, report the trend instead of inventing a precise lifetime conclusion.[1]
Communicate the task on the dashboard
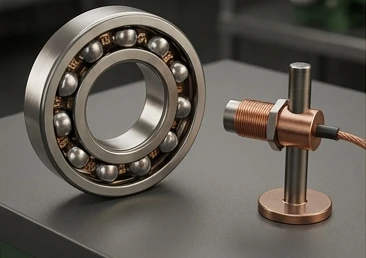
Name each dashboard output according to the quantity the model actually estimates. An anomaly score should be called an anomaly score rather than a failure probability unless a separate validated interpretation supports that probability. Likewise, a condition indicator is not automatically a remaining-life forecast. MathWorks distinguishes these tasks in its workflow documentation. An interface review asks a maintenance specialist to explain each output and its permitted use. If that explanation differs from the model specification, revise the wording before deployment. Clear labels help keep statistical observations from becoming unsupported operational instructions.[1]
Close the loop with inspection and learning
Deployment is part of the MathWorks workflow, but it is not a reason to stop evaluating the system. A suggested operational plan records alerts, inspection outcomes and changes to the machine or measurement system. That record helps determine whether the model's output remains useful and whether thresholds or task definitions need review. Assign ownership for responding to alarms and for resolving data-quality issues. Without that ownership, an technically interesting detector can become a dashboard that nobody knows how to act on or trust.[1]
Start with a narrow application and a conservative boundary between a model observation and a maintenance decision. Document what the system can identify, what it cannot infer and when a person must investigate. Track false alarms and missed findings using evidence rather than anecdotes. The engineering lesson is to connect measurements, condition indicators, model outputs and actions without skipping the uncertainty between them. AI can support maintenance reasoning when its task and evidence are explicit. It should not turn every unusual signal into a confident story about failure, nor replace the professional judgment required to keep machinery and its operators safe.[1]
Questions, answered.
Does an anomaly score identify the broken component?
Not by itself. Anomaly detection identifies deviation from expected behavior; diagnosis is a separate task.[1]
Is remaining useful life the same as anomaly detection?
No. Remaining-life estimation requires a forecasting model and a defined endpoint, while anomaly detection identifies unusual behavior.[1]
Read the sources.
- Predictive Maintenance Toolbox documentationMathWorks · Accessed 2026-10-14
AI assistance and source checks reduce risk; they do not guarantee error-free reporting. See our editorial policy.